End - End Statistics for Data Science
Statistics for Data Science
Definition
Statistics is the science, or a branch of mathematics, that involves collecting,
classifying, analyzing, interpreting, and presenting numerical facts and data. It is
especially handy when dealing with populations too numerous and extensive for
specific, detailed measurements. Statistics are crucial for drawing general
conclusions relating to a dataset from a data sample.
Types of Statistics
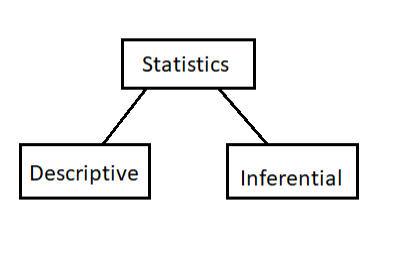
There are two types of Statistics:
1. Descriptive Statistics
2. Inferential Statistics
Types of Data
Quantitative Data:
1. Discrete Data
• It can take only discrete values. Discrete information contains only a finite
number of possible values. Those values cannot be subdivided
meaningfully. Here, things can be counted in whole numbers.
• Example: Number of students in the class, Number of bank accounts.
2. Continuous data
• It represents measurements and therefore their values can’t be counted
but they can be measured.
• Example: Height of a person (which you can describe by using intervals on
the real number line), Average Rainfall, Body Temperature
Qualitative Data/Categorical Data:
1. Nominal Data
• Nominal values represent discrete units and are used to label variables
that have no quantitative value. Just think of them as “labels.” Note that
nominal data that has no order. Therefore, if you would change the order
of its values, the meaning would not change.
• Example: Gender Type (Male, Female or Others), Language spoken by an
individual (English, Spanish, French, Hindi, or Others)
2. Ordinal Data
• Ordinal values represent discrete and ordered units. It is therefore nearly
the same as nominal data, except that its ordering matters.
• Example: Student’s performance in the exam (Outstanding, Good, Average,
Unsatisfactory, Failed). You can associate a rank or an order with each and
every label, i.e., Outstanding (1), Good (2) and so on.
Example of all types of data in a tabular form
Let’s take an example of ‘Student’ table below:
From the above example, we can see all four types of data. ‘Age’ is Discrete, ‘Height’ is Continuous, ‘Sex’ is Nominal and ‘Academic Performance’ is Ordinal data.
Sample Data & Population Data
- A population is the entire group that you want to draw conclusions about.
- A sample is the specific group that you will collect data from. The size of the sample is always less than the total size of the population.
Sampling Techniques:
- Descriptive statistics describe, show, and summarize the basic features of a dataset found in a given study, presented in a summary that describes the data sample and its measurements. It helps analysts to understand the data better.
- Descriptive statistics represent the available data sample and do not include theories, inferences, probabilities, or conclusions. That’s a job for inferential statistics.
Topics under descriptive statistics:
- Measures of central tendency
- Measures of variability
- Distribution (Also Called Frequency Distribution)
Let’s start with one topic at a time.
Measures of Central Tendency:
There are three fundamental concepts under this topic:
- Mean
- Median
- Mode


Comments
Post a Comment